Figure 1
Loading data from text format
How to run Descartes
Data format
Applications
First start
Multiple data displays and their linking
Descartes is a Java application and needs Java Runtime Environment
(JRE) (at least Version 1.1) to run. The latest version (currently Java
2 Runtime Environment 1.3) can be downloaded for free at: http://java.sun.com/products/j2se/1.3/jre
Descartes can be activated with a *.bat file that looks like this:
| d:\jdk122\bin\java -classpath CommonGIS.jar;d:\jdk122\lib\rt.jar esda_main.RunDescartes |
| d:\jdk122\bin\java | The path to the Java interpreter (may be different on your computer) |
| -classpath | A keyword indicating for the Java interpreter that the list of classes to load follows |
| CommonGIS.jar | An archive with classes of Descartes (CommonGIS); may have a different name |
| d:\jdk122\lib\rt.jar | The library of standard Java classes corresponding to the version of Java interpreter used |
| esda_main.RunDescartes | The main class of Descartes (CommonGIS) that starts the work of the system |
When this file is launched a Dos-Prompt is started and Descartes is started with a blank window.
First thing to do is to load the data you want to work with.
This is done with File ->Load data or File
->Load application
Descartes can work with different formates of data:
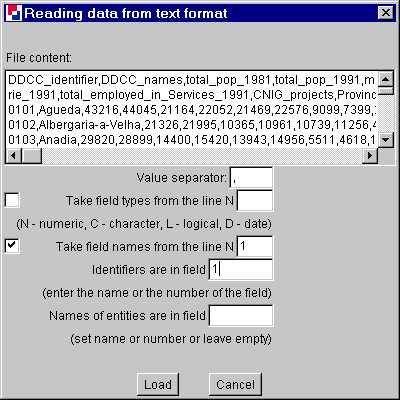
In order to load data from a file in text format, the system needs some
additional information:
It needs to know how the values are separated are (preselected), the
name or number of the field with identifiers (necessary), where the names
of entities are and where in the text the field types and the field names
are found (optional).

Figure 1
Loading data from text format
In this example the field names are to be found in line 1, the Values are separated by "," and the Identifiers are in field 1.
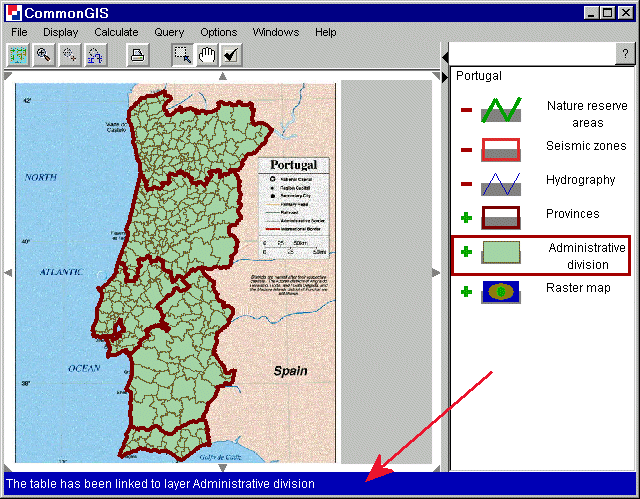
The bottom line of the map window shows whether the table (layer) was loaded correctly or not:

Figure 2
Portugal data implemented
The geographic data can either be added layer by layer and their parameters selected by hand, or they have been already put together in an *.app file (by previous saving).
The Descartes system may be started with giving the path to an application
file as an argument, for example:
| d:\jdk122\bin\java -classpath CommonGIS.jar;d:\jdk122\lib\rt.jar esda_main.RunDescartes data\wallis\wallis.app |
In this case the system will immediately load the data specified in the application file after its start. Otherwise, an application can be loaded using the command “Load application” of the menu “File” (this works only in a local variant of the system).
An application file lists map layers and tables to be loaded and provides important information for loading such as the data source or the table column with object identifiers. An application file also specifies layer properties such as color or line thickness.
There is no need to describe the internal syntax of the application specification language because Descartes applications can be built interactively. For this purpose a user starts the local version of the system, loads into the system one by one the necessary layers and tables, defines the appearance of the layers on the map and decides which layers must be loaded at start-up time and which will wait until the user explicitly selects them (such layers must be “switched off” but not removed!). After that the user selects the command “Save application” in the “File” menu, and the system will automatically write the corresponding application description in a user-specified file. Next time when starting the system the user can load the so created application.
It should be noted that, when dealing with applications, Descartes applies, whenever possible, so-called delayed data loading. This means that geographic data for a layer that is initially switched off will not be loaded until the user explicitly switches the layer on. Similarly, thematic data are not loaded until the user first addresses a table, for example, wishes to view this table or visualize attributes from it. However, if data for a table are stored together with geographic data for some layer (i.e. in the same data source), and this layer is initially switched on, the table will be loaded simultaneously with loading the layer.
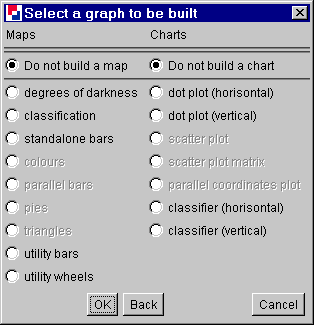
Figure 3 shows the window where the visualization method can be chosen from.

Figure 3
Visualizing one attribute
The visualization methods for maps are explained here.
And those for charts here.
Descartes supports two kinds of highlighting: transient and durable. Transient ("mouse-over") highlighting occurs when the mouse cursor is positioned over an object and is switched off immediately after the mouse is moved aside. Durable highlighting occurs when an object is selected by clicking or dragging the mouse and lasts until the user explicitly cancels it. Click on a durably highlighted object cancels its highlighting. Click in an object-free area of any display cancels highlighting of all objects. Descartes uses white color for transient highlighting and black for durable highlighting.
Selection by mouse dragging is automatically enabled in all noncartographic
displays. In a map window mouse dragging can be used as well for zooming
and shifting of the viewport. The user can switch between different interpretations
of mouse dragging using button switches in the tool bar of the map window.
In a map with several layers only objects of the active layer can be
affected by highlighting. To make a layer active, the user should click
on it in the legend. When the active layer changes, highlighting of objects
from the previously active layer is cancelled. It will appear again when
this layer is activated once more.