Figure 1:
An example map legend.
Tool bar
Menu bar
General interface features
Record
options
The main window of the program is divided into a menu bar, where the commands are, a tool bar and the map window.
A map window contains two subwindows one with the map and one where the
map legend and the manipulation tags appear.
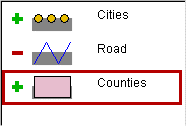
The legend (see image 1) shows
the layers the map consists of, the status (drawn or hidden) of each layer, the
visual properties such as color or line thickness, the order of the layers in
the map, the status of the Labels, and the active layer. The active layer is
the layer whose objects react to mouse events, such as, pointing on an object
with the mouse cursor or clicking on an object.

Figure 1:
An example map legend.
For each map layer there is an item in the legend that consists of the
following elements:
· "Plus" or "minus" icon indicating whether the
layer is drawn or not. The icon is sensitive to mouse clicks. Upon a mouse
click the icon is changed to the opposite (that is, plus to minus and vice
versa), and so does the drawing status of the layer.
· An image
representing the type of the objects in the layer (point, line, or area) and
their current visual properties. For example, in figure 1 the layer "Cities"
consists of point objects, the layer "Roads" - of linear objects, and the layer
"Counties" - of areal objects.
· In a small box next to the image an
"L" indicates an active labeling. The identifier of the object is depicted in
the center of the corresponding area on the map, depending whether it fits in
it or not (as shown in figure 2).
· The name of the layer.
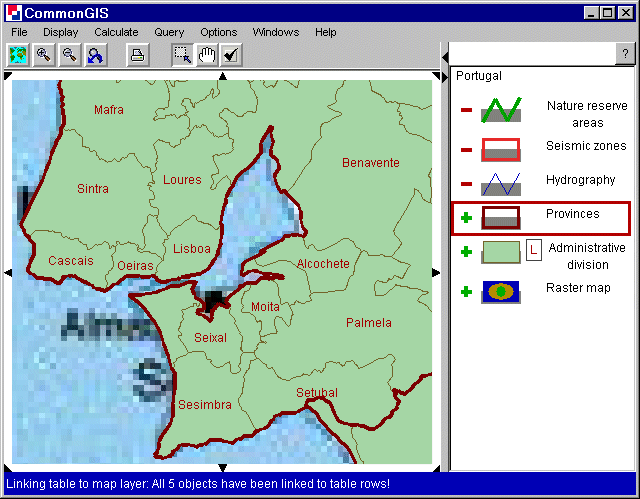
Figure 2
Portugal - Region of Lisboa; labels on
When visualization of thematic data is added to a map, the legend item of the corresponding map layer is extended to include the explanation of the symbols used for the visualisation.
Through the legend it is possible to do following interactive operations:
| switch on/off drawing of a layer | click on the "minus" or "plus" icon |
| change the active layer | click on the legend item of the layer that should become active (but not on the "plus" icon) |
| change the order of drawing of the layers | drag the legend items to the desired positions. Note that layers shown at the bottom of the legend are drawn first, and the layers at the top are drawn last |
| change the visual properties of a layer | double-click on the corresponding legend item. A dialog for editing of the visual properties will appear on the screen (colors, labels) |
| remove layer | right button mouse click on an item of the layer |
The little button with the ? in the upper right corner gives help on the legend in an browser window.
The map itself is surrounded by little black triangles: on every corner and in the middle of every side. They cause a moving of the map display in the direction the triangle is showing.
The tool bar is mouse-sensitive. When the cursor remains on a button, a little help window appears next to it and gives a short description, what its effects are.
![]()
Figure 3
Tool bar
The first 4 buttons are used for map zooming. First one makes the map
fit in the window. The next two zoom in and out. And the last one undoes the
last zooming action.
The button in the middle is for printing. A window pops
up with special options for the printer.
The three buttons on the right
indicate the mouse options. The left one makes a rectangle when dragging across
the map and zooms in this part. The one in the middle makes a straight line
when the cursor is being dragged. The map moves as if it is pushed in the
direction the line was dragged and as far as the line long was. When the right
button is checked, objects on the map can be selected by dragging. The objects
in the box shown while dragging are added to the selected ones (black outline).
When selected objects are selected again, the activation is removed. All
selection can also be removed by clicking on an object free area.
In the head line following operations can be done:
| File |
|
||||||||||||
| Display |
|
||||||||||||
| Calculate |
|
||||||||||||
| Query |
|
||||||||||||
| Options |
|
||||||||||||
| Windows |
|
||||||||||||
| Help |
|
The Descartes system supports two kinds of highlighting: transient and durable. Transient ("mouse-over") highlighting occurs when the mouse cursor is positioned over an object and is switched off immediately after the mouse is moved aside. Durable highlighting occurs when an object is selected by clicking or dragging the mouse and lasts until the user explicitly cancels it. Click on a durably highlighted object cancels its highlighting. Click in an object-free area of any display cancels highlighting of all objects. Descartes uses white color for transient highlighting and black for durable highlighting.
When "drag to reorder" is written under a list, then it is possible to change the order by dragging one item to the wished position (a little arrow appears).
A split panel has little black arrows indicating that it is possible to maximize the subwindow in the direction it is pointing (see Figure 4). The hole segment can be dragged to make a subwindow smaller or bigger.
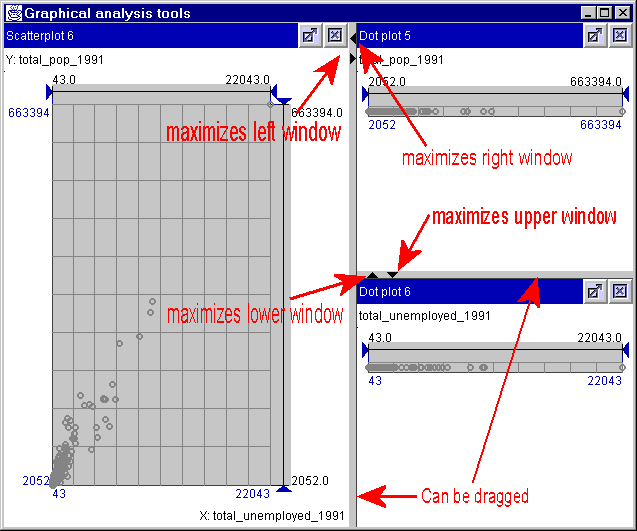
Figure 4
The record options (Headline: Options -> Show record options) change the modes and properties of showing attribute values when touching an object with the mouse (figure 5). When "Enable record display in popup window" is active, then a window next to the mouse pointer appears with the name of the object pointed at and the values of the visualized attributes. The number of lines can be limited.
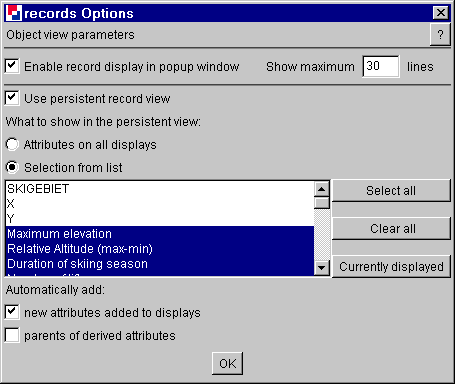
Figure 5
Wallis - Show record options
A new tag, next to the legend of the map, appears, when "Use persistent record view" is enabled (see figure 6). It indicates the attributes of the selected objects. How many and which attributes are shown can be set in the record option window (all or only selected ones, etc.)
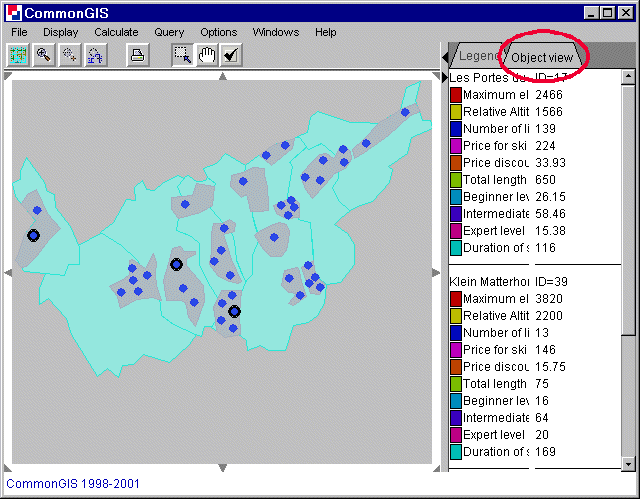
Figure 6
Wallis - Object view
Also see: Lookup attribute values