Looking up attribute values
Many graphical
displays that can be produced by the system represent some objects having
associated thematic data (values of various attributes). For example, on a map
such objects are shown by linear or areal symbols or by geometric signs or
icons. On a scatter plot or a dot plot an object is represented by a small
circle, on a parallel coordinates plot - by a broken line.
There are two ways of viewing attribute values associated with an
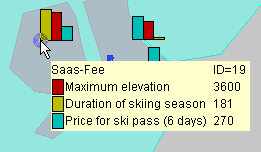
object. First, the values may be shown in a popup window that appears when the
mouse cursor points on the graphical element representing the object (see
Figure 1).

Figure 1
Display of attribute values in a popup window. The mouse cursor
points on an object in a map. The popup window shows the values associated with
this object.
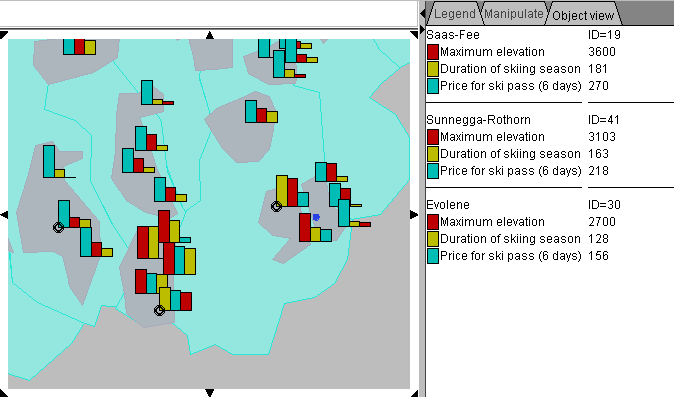
Second, the user may open a so called "persistent object view" (Figure
2). When the user selects an object in any display, the corresponding attribute
values are added to the persistent object view and remain displayed until the
user explicitly deselects the object. Hence, the persistent object view is
independent of mouse movements and can show simultaneously data referring to
several objects. Selection and deselection of an object is done by clicking on
it or by enclosing it in a rectangular selection frame. On the map in Figure 2
selected objects are marked by black circles. Selected objects are specially
marked in all graphical displays to be visually well distinguished from the
rest of the objects.

Figure 2
Display of attribute values in a persistent object view
included as a subwindow in a map window. Currently selected objects are marked
on the map by black circles. The object view shows the attribute values
corresponding to these objects.
In order to enable or disable viewing attribute values in a popup window
or in a persistent object view, set the corresponding options of the systems
(available through the menu item "options").
Important notes about viewing attribute values in a popup window:
- Viewing of attribute values in a popup window is by default
enabled.
- The window is shown only while the mouse keeps pointing on the
object in some of the displays and disappears when the mouse moves.
- The window shows only values of the attributes that are visualized
on the display containing the mouse cursor. Thus, if the cursor points on some
dot (circle) in a scatter plot, only the values of the two attributes
represented on this scatter plot will be shown.
- On a map only data referring to the active layer are shown. To view
data from another layer you should make that layer active.
Important notes about the persistent object view:
- Persistent viewing of attribute values is by default disabled. It
may be enabled by changing the settings of the system (see the menu item
"Options").
- Objects to add to the object view can be selected from any of the
displays currently present on the screen.
- Selection and deselection of objects through mouse clicking (in
any display) is disabled when mouse click events are used for map
manipulation such as visual comparison. Analogously, selection in a map
through a frame is disabled when mouse dragging is used for zooming and
panning. In order to change the interpretation of mouse click or mouse drag
events, use the tool bar of the map window.
- Selection of objects in a map is only done in the active layer.
- There are two modes of the persistent view: show currently
visualized attributes (in all the displays currently present on the screen) or
show attributes explicitly selected by the user. In the first mode the
attributes are automatically added to or removed from the object view when new
displays are created or some displays closed. In the second mode once selected
attributes will remain in the object view until being explicitly deselected. To
switch between the modes and to select attributes to view, use the
corresponding option setting dialog available through the menu item
"Options".
Back to contents


