Figure 1
Sum of all age groups
Sum of columns
Percentages and
ratios
Change, difference
The selected attributes are summed up and a new attribute is created. A suggestion for the name of the new attribute is given, but can be edited. This new attribute is then displayed on the map by degrees of darkness.

Figure 1
Sum of all age groups
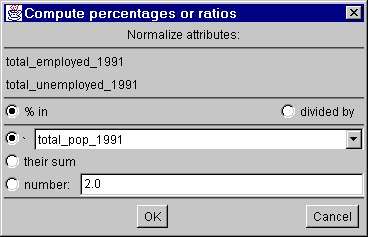
To calculate the percentage of one attribute according to another check
the "% in"- button and select an attribute from the list beneath it.
When
more than one attribute was selected before (otherwise it would not make sense)
and the button "their sum" is activated, Descartes creates the sum of all
selected attributes and calculates the percentage of each attribute to it (one
attribut <-> sum).
And when "number:" is activated Descartes
calculates the percentage of the attribute(s) to the number entered.
The
ratio is calculated when "divided by" is checked. The different methods are the
same as if the percentage is being calculated.
Note: The attribute which is
supposed to represent the whole can not be taken from the list of selected
ones.

Figure 2
Percentage of employed and unemployed according to
the population in 1991
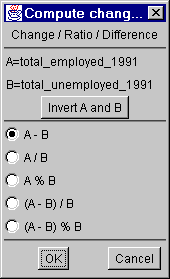
From 2 attributes Descartes can calculate the change, ratio and
difference. It leaves the opportunity to choose between "A-B", "A/B", "A%B" ,
"(A-B)/B" and "(A-B)%B", where a%b gives the remainder of dividing two numbers
a and b.
Press "Invert A and B" to switch the roles of A and B.

Figure 3
Difference between employed and unemployed